Posted by ksteineman on May 30, 2013 in Mobile |
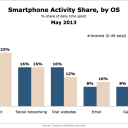
As discovered today by Experian Marketing Services, Americans spend about an hour every-day on their smartphones (58 minutes to be exact). When we dig a little deeper it is evident that iPhone users spend an average of 1hr and 15 mins on their devices (26mins or 53% more) than Androids average of 49 minutes. Breaking things down even further.. Android users spend more of their time talking: 28% vs 22%. As well as, visiting websites: 16% vs 12%. When it comes to emailing, and texting however – iOS lead with 22% vs 16% and 10% vs 8%. They spend the same amount of time social networking and gaming at...
Posted by ksteineman on May 27, 2013 in Random, Funny, or Cool, Startups |
Following a recent visit to a ‘wearable tech’ event I attended here in San Francisco. I had a chance to meet some cool dudes who are working on some cool things. I am of course referring to their Epiphany Eyewear product which is basically a pair of sun glasses that allows you to record video, decrease sun brightens with a button, and looks cool all at the same time. If you’ve been holding out for Google Glass, and just CAN’T WAIT to have a pair of sunglasses that can record video (and other cool things) then maybe EpiphanyEyewear is what you’ve been looking for. Starting at $299 (8gb) and...
Posted by ksteineman on May 26, 2013 in Marketing, Mobile |
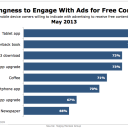
This is always an interesting thing to look at. At which point do people succumb to incentivization? Well, according to a new chart from Tapjoy & Yankee Group the breakdown goes like this: Below is the percentage of mobile device owners willing to engage with advertising to receive free content. Tablet App, 77% Paperback book, 75% MP3 download, 73% Tablet app upgrade, 73% Coffee, 71% Smartphone app, 70% Smartphone app upgrade, 67% Newspaper, 66% After-all, who pays for things these days when you can just be solicited to? The stats above, as well as the image below make it more than evident that this is the case for most...
Posted by ksteineman on May 26, 2013 in Mobile |
According to a new infographic by Glassdoor (which has information on more than 250,000 companies, 20 million registered users, and 13 million monthly unique visitors) a new infographic has uncovered some interesting statistics. I’ll list a few, then the rest you can see in the infographic below. 68% of job seekers use their mobile device to search for jobs at least once a week. 3/5 seekers have done so in the past. 30% search for jobs more than once a day on their phone. All in all, Glassdoor surveyed 1,100 employees and job seekers online. More in the infographic...
Posted by ksteineman on May 25, 2013 in Apps, Mobile, Startups |
Appfuel (formerly AppSpree) is a company that was forged on the foundation of culture, which is something I see as an especially important subject (as well as one that seems to rise to the top of discussion among founders and CEO’s I encounter) in the startup world quite often. Upon discovering that CEO and Co-Founder Andrew Boos and Co-founder Alfred Kam had actually known each-other for more than 10 years, it was clear to me that this type of ‘cultural foundation’ had already been established, not to mention their network in China (Beijing – having been involved in an accelerator). With a current team that has survived a couple pivots, and...
Posted by ksteineman on May 25, 2013 in Mobile |
What does OTT even mean? Oh wait, ‘Over-the-top’ messaging. I suppose that is what you would consider a messaging service where you can send stickers, non-traditional emoticons, and more. Almost like MSN messenger WAY BACK when. In any case, evidently a new infographic from the folks over at Acision has revealed that 80% of UK smartphone users use OTT services, of which 76% admit they use them in addition to IM services. Think: What’sApp + ichat. Not that uncommon, I know I do it. The infographic below has a lot more cool stats, check it...
Posted by ksteineman on May 24, 2013 in Marketing, Random, Funny, or Cool |
Saw this one over at Mashable, had to snag it. After-all, what’s the point of using all these buzz words in the first place? Why can’t we just have a conversation like NORMAL people? I was talking with my friend Desmond a few days ago about aligning some strategic partnerships with our lead generation company and those in the direct sales industries and as I was describing it to him he straight up told me, “I don’t care about all that Mumbo Jumbo“. I found this especially intriguing (and couldn’t help but crack a smile as we were talking over the phone) because this is coming from a guy who went...
Posted by ksteineman on May 23, 2013 in Apps, Marketing, Mobile |
Why waste time on this one. Let’s just get into the nitty-gritty so you can be on your way, enjoying the day ahead, and most importantly – launch that App of yours. 1) Track Your Performance. There are various ways of doing this, and it’s critical to your success. Once your app is published it’s important to track initial user experience both quantitative and qualitative. While there are more than enough platforms out there to help you do this, here are a few: App Annie, Localytics, Flurry. To distinguish the two varying methods of ‘tracking’ above quantitative refers to: specific metrics relating to user actions, whereas qualitative would...
Posted by ksteineman on May 23, 2013 in Apps, Marketing, Mobile |
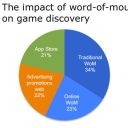
That’s right. In a recent survey conducted by Applifier (with 1,800 mobile gamers) it was discovered that 57% of new game discovery awareness is a result of word-of-mouth. That doesn’t surprise me to be honest. Online awareness is considered as: Seeing a facebook post (24%) Watching a trailer for a game on YouTube (18%) Seeing a screenshot shared by a friend (9%) When it comes to the word-of-mouth side of things (and how they influence gamers decisions to download) Reading user reviews (43%) Hearing from a friend/family member (36%) Seeing a friend/family member play the game (25%) Seeing a Facebook post by a friend or family member (24%) The...
Posted by ksteineman on May 23, 2013 in Marketing, Mobile |
App Analytics company Localytics has updated their funnel tool today to give enterprise customers the ability to drill down and pull information on funnel conversion rates. Additionally, you’ll now be able ‘expand funnel steps’ for better insights on what’s taking place during the whole conversion process. As seen in the image below, the ‘conversion trend chart’ depicts with its line how far users are going through the conversion funnel. If users aren’t converting the way you anticipated, then the ‘event table’ (below) shows what they did instead. More so, the information shows: what’s working and what’s not. Furthermore, there is a ‘drill down table’ which splits your converted vs...



![68% of Job Seekers user their mobile device to search for jobs at least once a week. [INFOGRAPHIC]](http://mobileminute.info/wp-content/uploads/2013/05/glassdoor-infographic-243832_128x128.jpg)

![80% of UK smartphone users use OTT services [INFOGRAPHIC]](http://mobileminute.info/wp-content/uploads/2013/05/Acision-Logo-34526_128x128.png)
![30 Most Overused Buzzwords in Digital Marketing [INFOGRAPHIC]](http://mobileminute.info/wp-content/uploads/2013/05/BuzzwordsNEW1-2089218_128x128.png)

