
Flurry’s Latest Report – Phablets Just a Phad?
App analytics firm Flurry (who now detects near 1 billion smartphones and tablets use around the world every month) has released a report (yesterday) that concluded mid-sized phones dominate, Phablet’s are a Fad. Also stating, “They dont’ show significant, or even disproportionally significant app usage.
To arrive at this conclusion Flurry focused on the top 200 device models, as measured by active users in Flurry’s system, which account for more than 80% usage. Doing so allowed 5 leaders to emerge based on the screen sizes below:
1. Small phones (e.g., most Blackberries), 3.5” or under screens
2. Medium phones (e.g., iPhone), between 3.5” – 4.9” screens
3. Phablets (e.g., Galaxy Note), 5.0” – 6.9” screens
4. Small Tablets (e.g., Kindle Fire), 7.0” – 8.4” screens
5. Full-size tablets (e.g., the iPad), 8.5” or greater screens
The image below reinforces the statement showing ‘Phablets’ with the lowest %’s of shares for: Device Models, Activer Users, and Sessions.
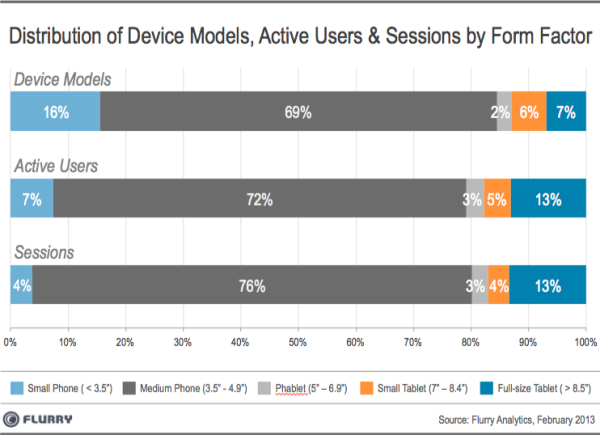
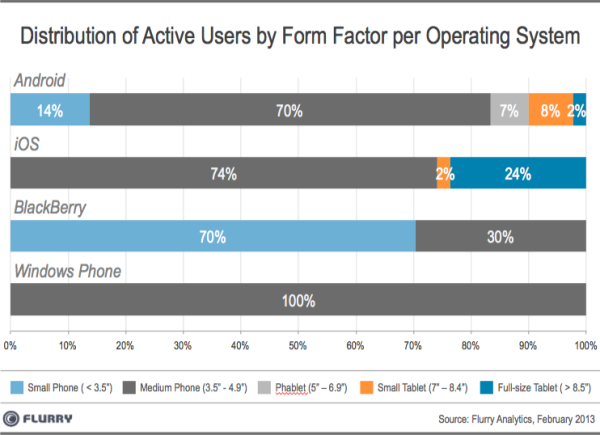
It’s important to note that while 16% of device models in the market are small phones, they only account for 7% of actual active users, and an even smaller 4% of over-all app sessions. Interestingly, the opposite is true for tablets which account for 7% of device models, 13% of active users, and 13% of over-all app sessions. Flurry believes the reasoning for this is because smaller devices are often older and therefore have fewer active users per device (mainly because they’re not well-suited for apps). When we look at Form Factor, it’s clear that the only Windows device models that are in the top 200 device models in terms of active users are medium-sized phones. (see image below)
When looking at Tablets, it’s very evident that these device are ‘Gaming Machines’. The chart below shows time spent in the top 3 categories distributed across different form factors.
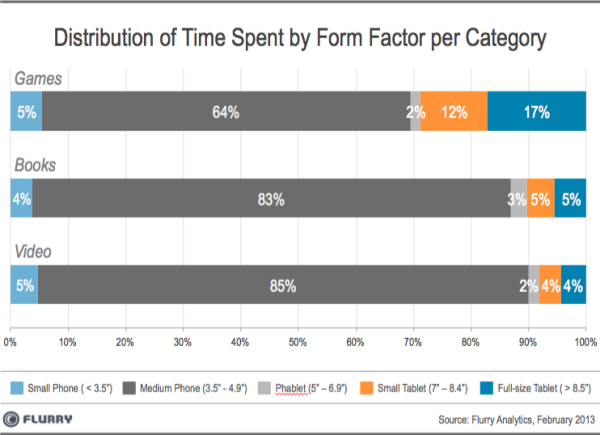
Starting at the top, it’s evident that nearly 1/3rd of games are being played on larger devices (Phablets 2%, Small Tablets 12%, and Full-Size tablets 17%). While they may command consumer time, they actually only represented 15% of device models in use in February.
It’s also interesting that ‘Books and Videos’ still have the majority of consumers time coming from mid-sized phones. Flurry believes that, perhaps consumers watch videos from their smartphones ‘on the go’ while at home they are more likely to view them on a tablet, or desktop.
Kevin is an Online and Mobile Marketing Strategist who has worked with companies of all sizes over the last 6 years. You can follow Kevin on any of the social platforms below.


0 Comments
Trackbacks/Pingbacks