A Day in the Life of the US Mobile Consumer
Mobile analytics company Flurry, who has been around for near 5 years and has more than 300,000 apps that log 3 billion app sessions per day has shared with us some interesting data through SourceDigital13. Particularly, data which reveals the engagement levels of US Consumers throughout the day.
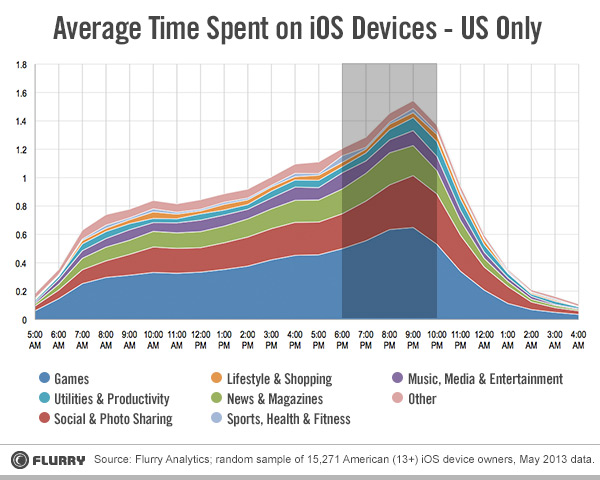
From a sample of over 15,000 US iOS users Flurry has measured the app usage throughout the month of May, 2013. The data depicts a 24-hour cycle to understand the usage throughout the day.
Flurry concludes that the following insights can be derived from the chart above, such as:
- “App usage steadily increases over the course of the day and ultimately peaks in the evening (unlike TV which remains low then has a dramatic jump in the evening.) This is a big change of perspective for media planners who have been used to weighting their budgets toward evening TV. In an app-centric world, that spend could effectively be spread throughout the day given consumers are reaching for their devices consistently throughout their waking hours.
- Wearable computing already arrived with the smartphone. Our data confirms what many of us know from experience: smartphones, tablets and the apps installed on them appear to be glued to consumers 24/7, 365. They are with us when we wake, work, exercise, eat, play and yes, even when we sleep. We have entered the era of “wearable computing” without needing the wearable gear. Even ahead of the mainstream adoption of Google Glass or Apple’s rumored wrist device, consumers are already embracing the wearable lifestyle with smartphones and tablets.
- While gaming still consumes a large portion of the time spent on devices, other categories appear to be closing the gap when it comes to consumer attention. With the proliferation of social and photo sharing apps, consumers are switched on and sharing every aspect of their lives.
- Shopping and lifestyle apps are used around the clock. Breakfast time, lunch time, dinner time and bedtime have become shopping time.”
Digging a bit deeper.
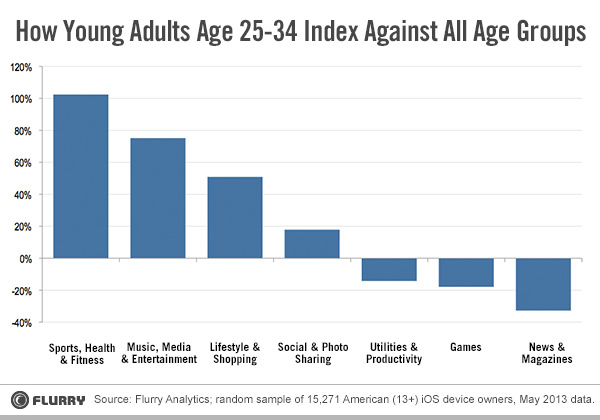
Flurry drilled into the 25-34 age segment, which is a highly-desirable segment for brands and advertisers to target. In the chart below you can see app usage based on this segment alone.
(In this chart, 0% represents average usage across all age groups. Positive percentages reflect the degree to which app usage for the 25-34 year old age group exceeds that of iOS users in other age groups.)
Surprisingly, millennials under-index for game app usage. The truth is, Gen X-ers who grew up with console gaming are the ones powering things along for games. It is also evident that millenials under-index’ed in Utilities, and News. In contrast, they over-indexed in Sports, Music, Lifestyle, and Social.
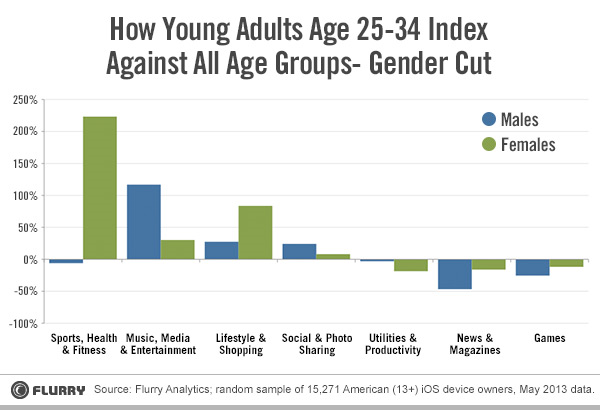
Going one step further, Flurry broke down the gender usage between this selected age group (25-34). The results are shown in the graph below.
It is very evident that Women over-indexed Men substantially in the areas of: Sports and Lifestyle. Whereas, Men over-indexed Women in the areas of: Music and Social.
Takeaways.
Women may be bigger sports fans than men, but Men still rock out more than Women. While Women may spend more time shopping around for what dress they’re going to wear, Men spend more time socializing to their friends about how much better that dress looked on the bedroom floor. Neither Men or Women in this segment has much interest in Utilities, News, or Games.


