
Are You a Mobile Install Addict?
As the year comes to a close it’s important to reflect back on what’s occured both in our personal lives and profesional as well. Thanks to the folks at Flurry, they’re making this easier than ever by providing us some very insightful datapoints on the: trend of app installs among users.
It was previously expected that given the extremely rapid adoption of Smartphones in the U.S. and South Korea there would also be a point (this year) when those markets saw a deceleration in app downloads due to market saturation.
Paul Adams of Intercom went on to predict that, “apps will become more of a service layer, replaced by enhanced notifications as the consumer interface.”
Flurry, being the data junkies they are (in a good way) decided to put this theory to a test. Below are a few images of their findings, which, by the way, clearly indicate users app consumption even great than it was in 2012.
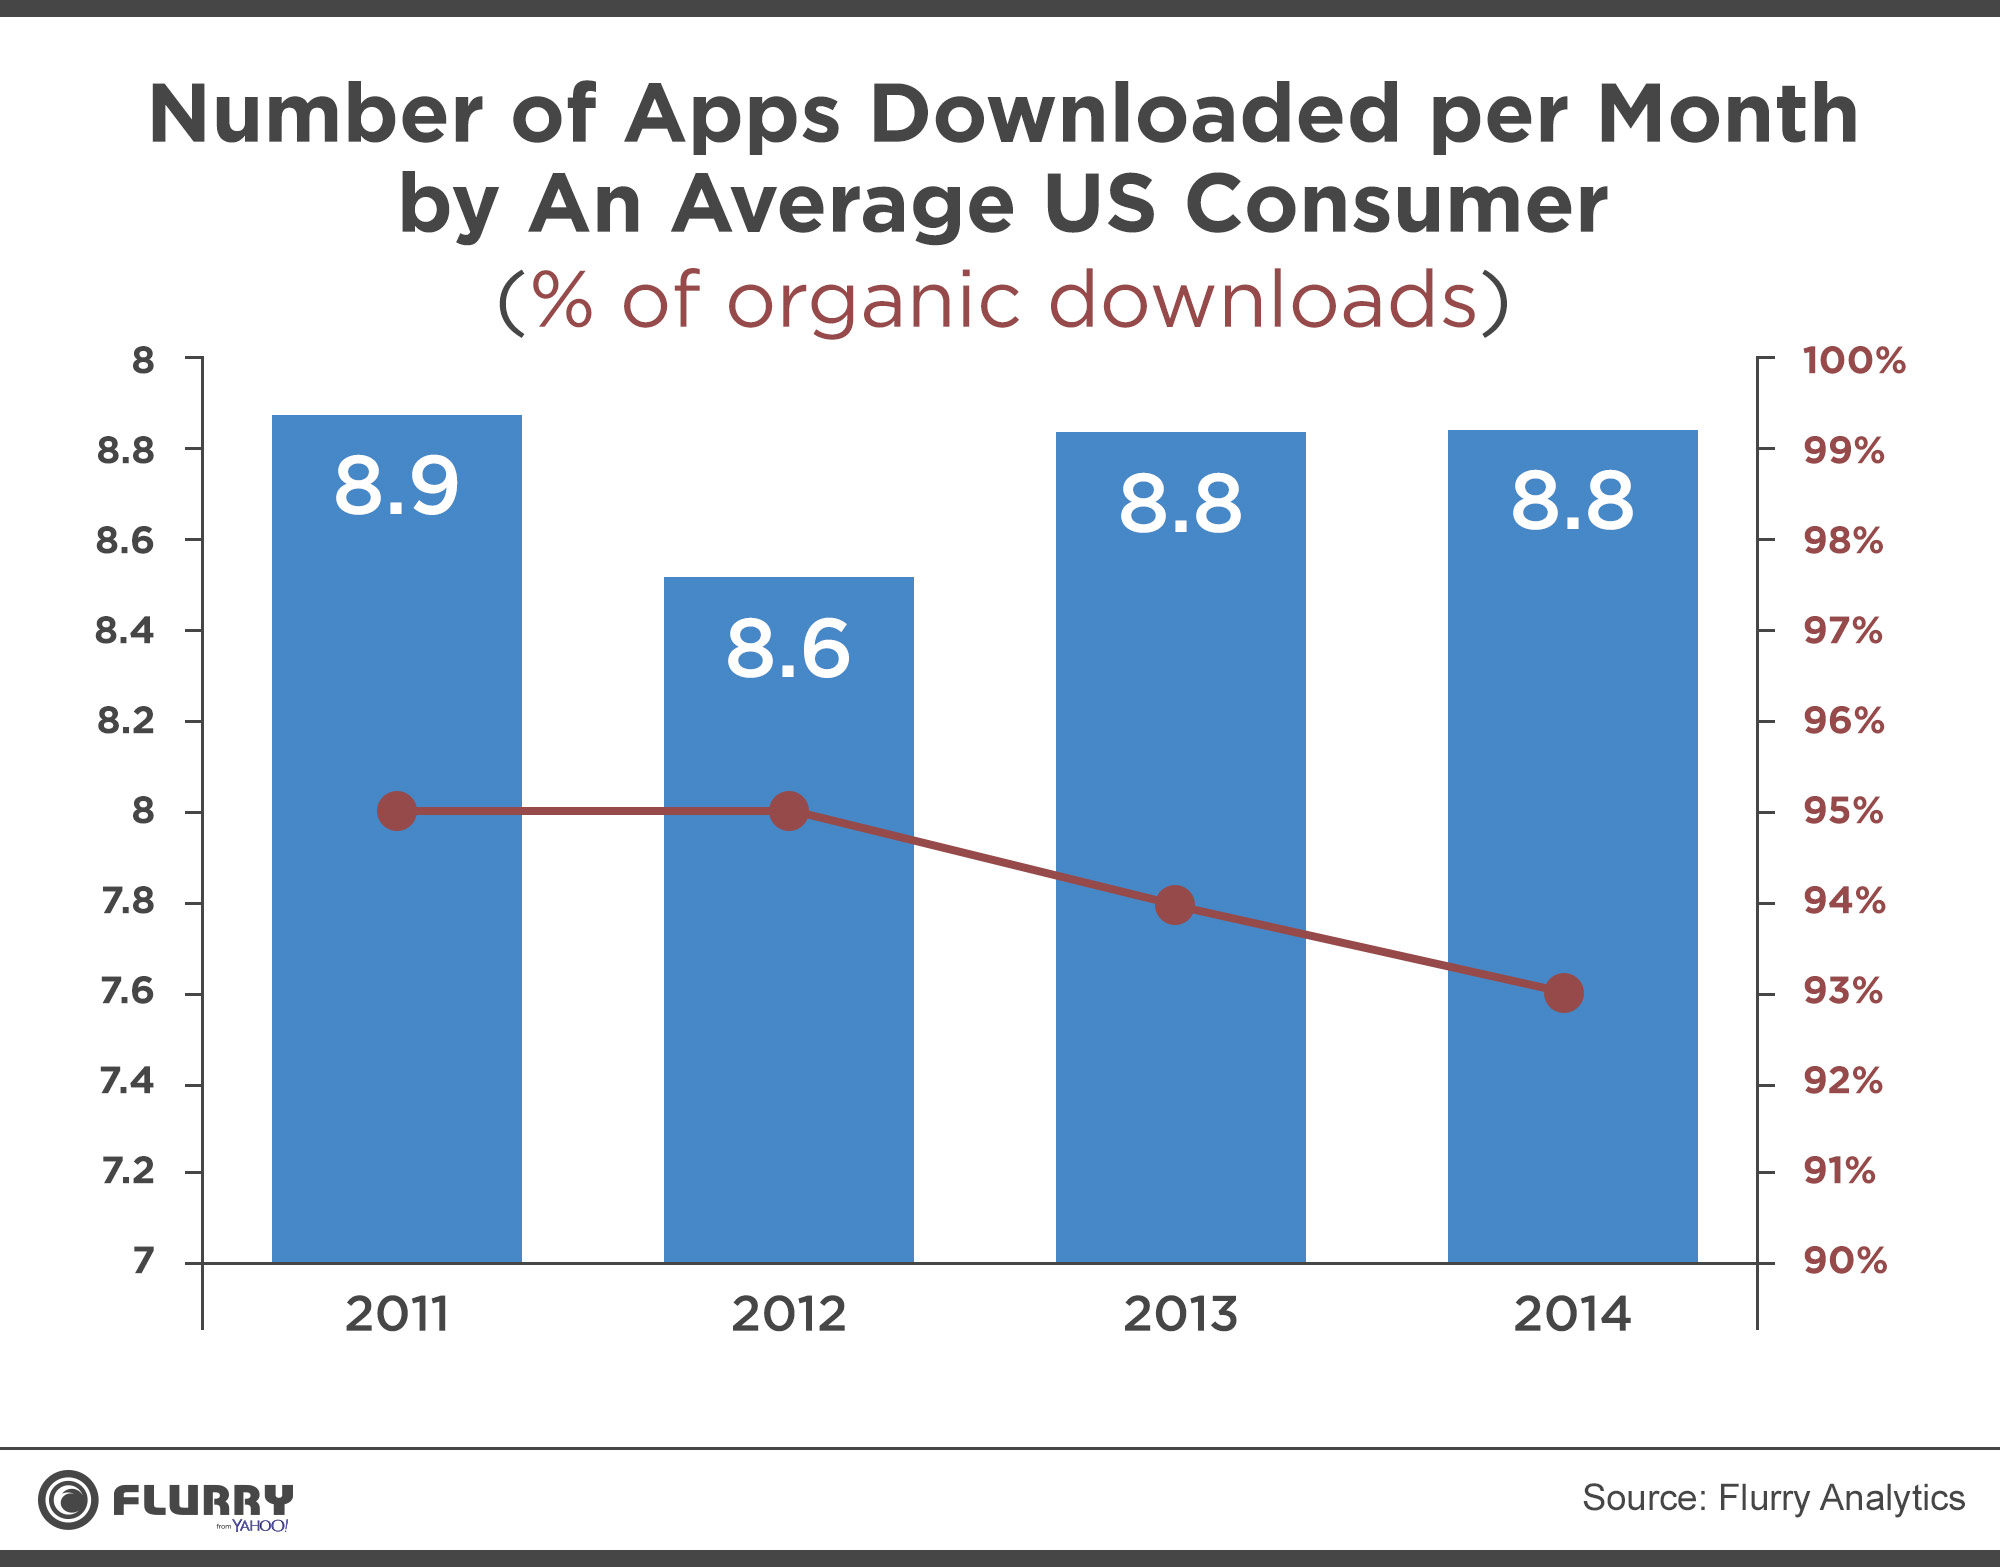
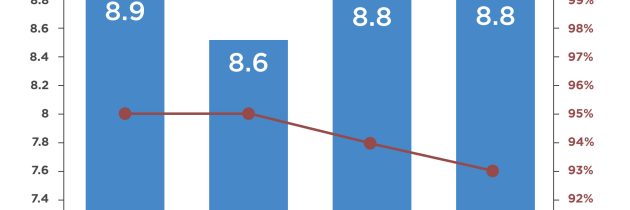
As seen in the image above, there was a slight dip in 2012 from an average of 8.9 apps per average user to 8.6. In 2013 however it clearly rebounded to almost its previous high of 8.9, at 8.8.
Despite the fascinating growth of app install ads, (and the rising cost that comes with them) the majority of app downloads are still organic. Flurry also found that in 2014, 93% of all app downloads in the US were organic, compared to 95% in 2011.
Digging a little deeper, it was discovered that the majority (54%) of users are actually downloading less than 8 apps per month. To keep things afloat, enter the ‘Install Addict’ who is a user that averages more than 17 apps per month. This includes apps downloaded on all smart devices the user owns. This segment represents 20% of the US mobile consumer base or an estimated 32 million people.
The chart above shows how an ‘Install Addict’ plays out in comparison to the other user segments in the App Store. The findings were based on a 100k devices.
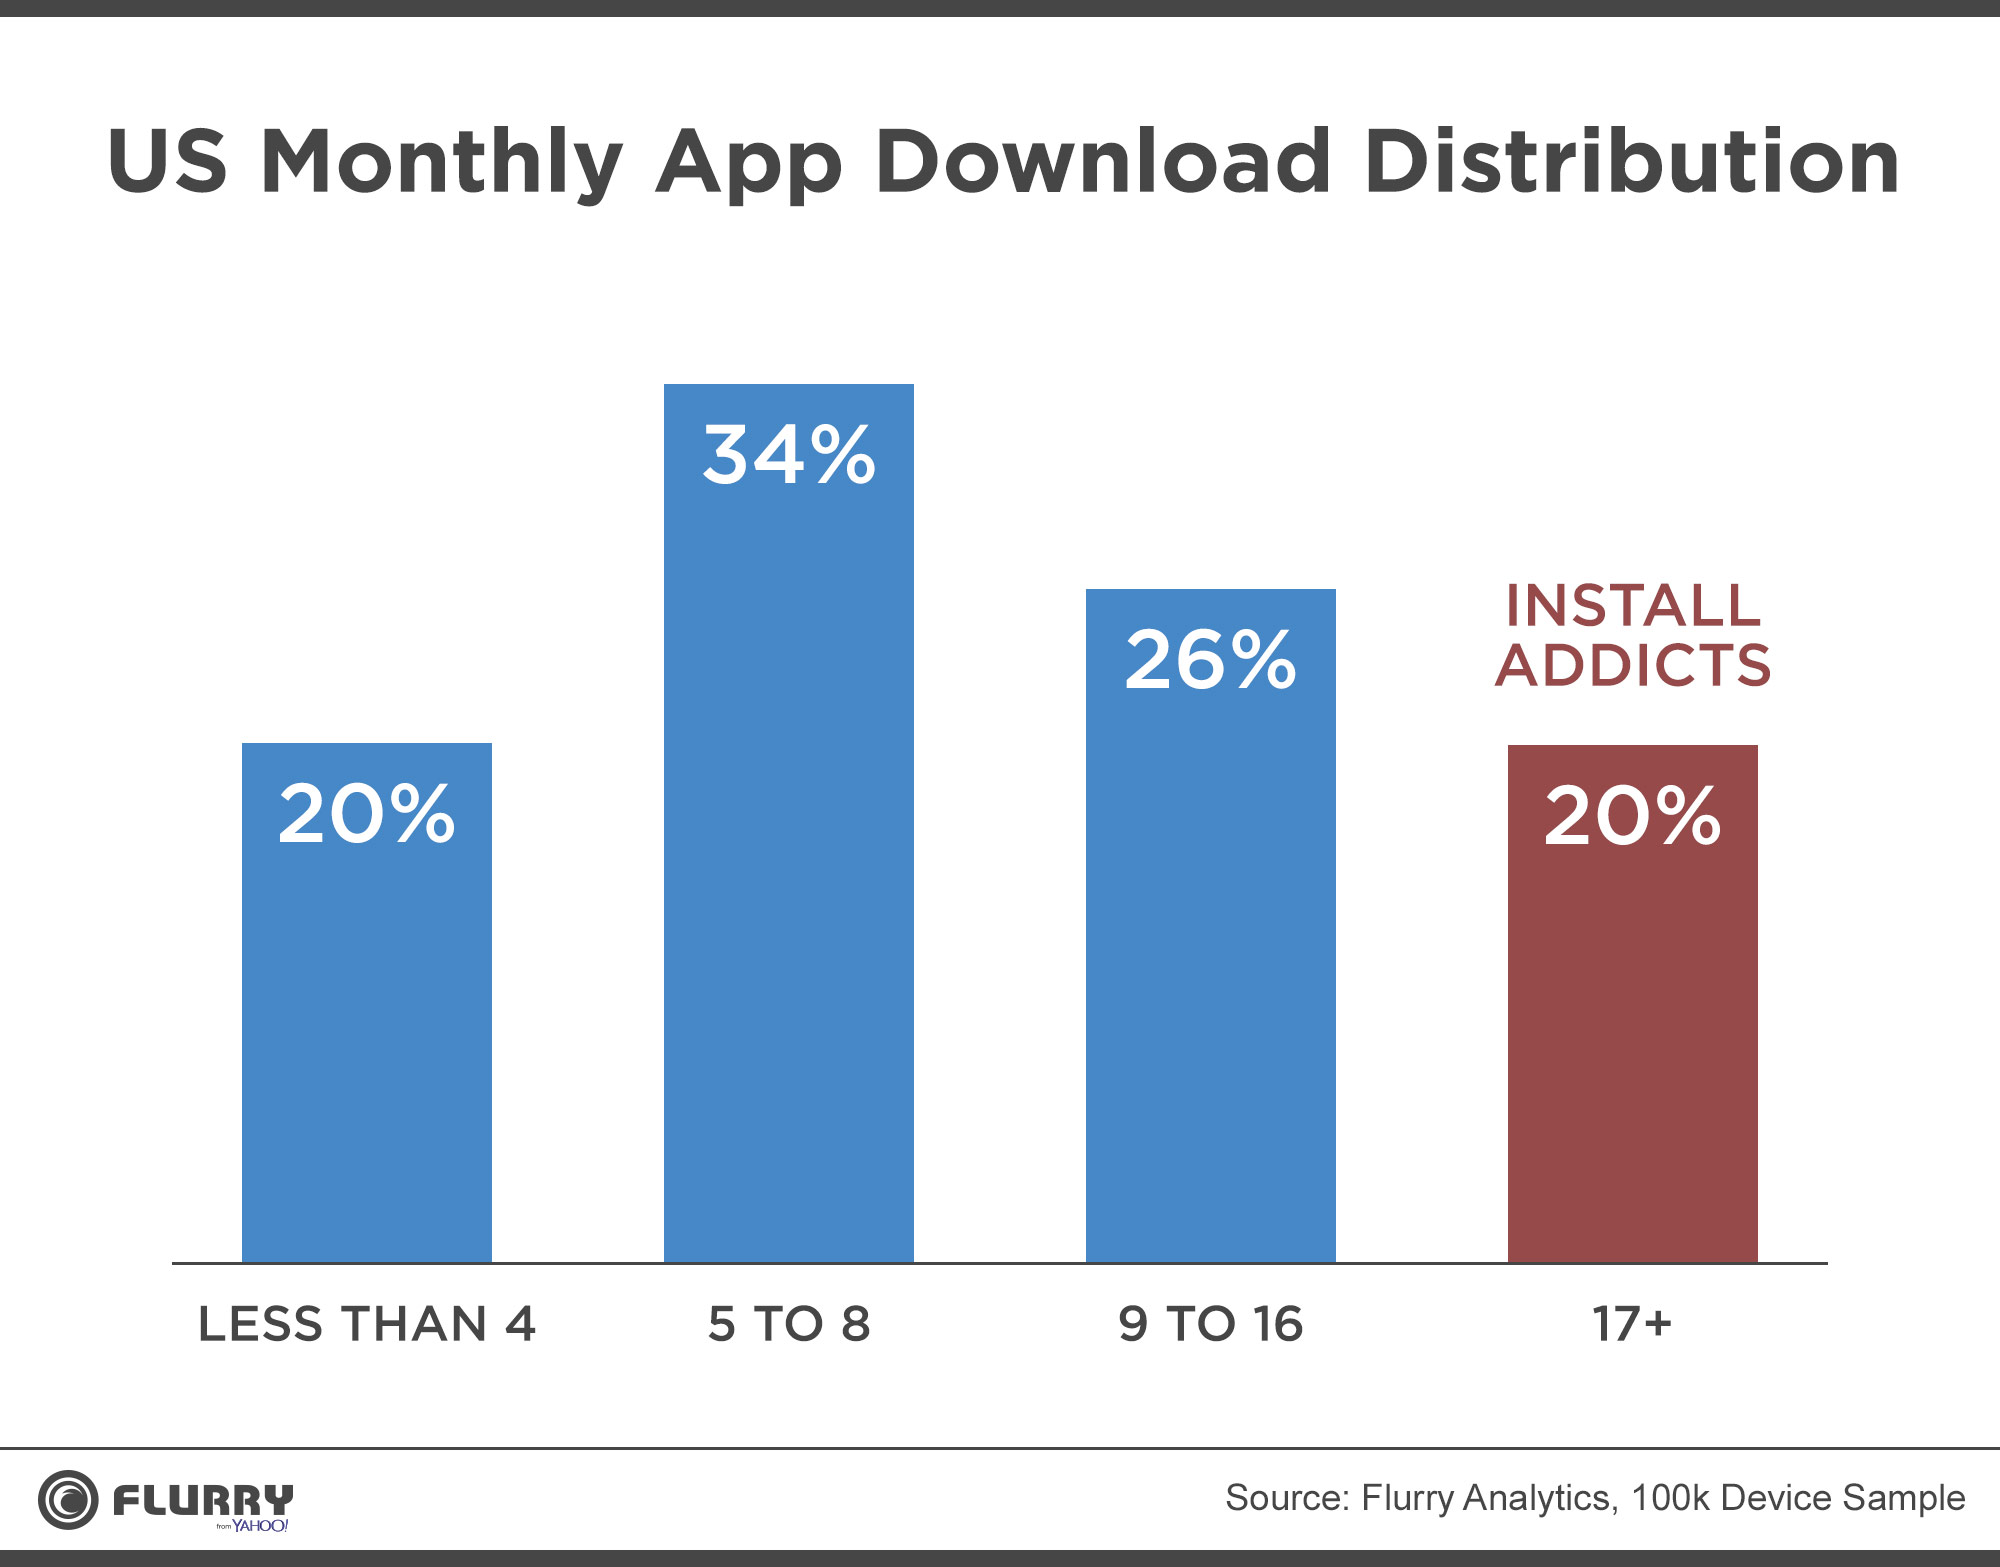
Digging deeper still with the chart above, it is seen that women over-index by 10% when it comes to being an Install Addict. Whereas men under-index by 10%.
In all, install addicts are 53% female and 47% male, compared to 48% female and 52% male for the average mobile consumer.
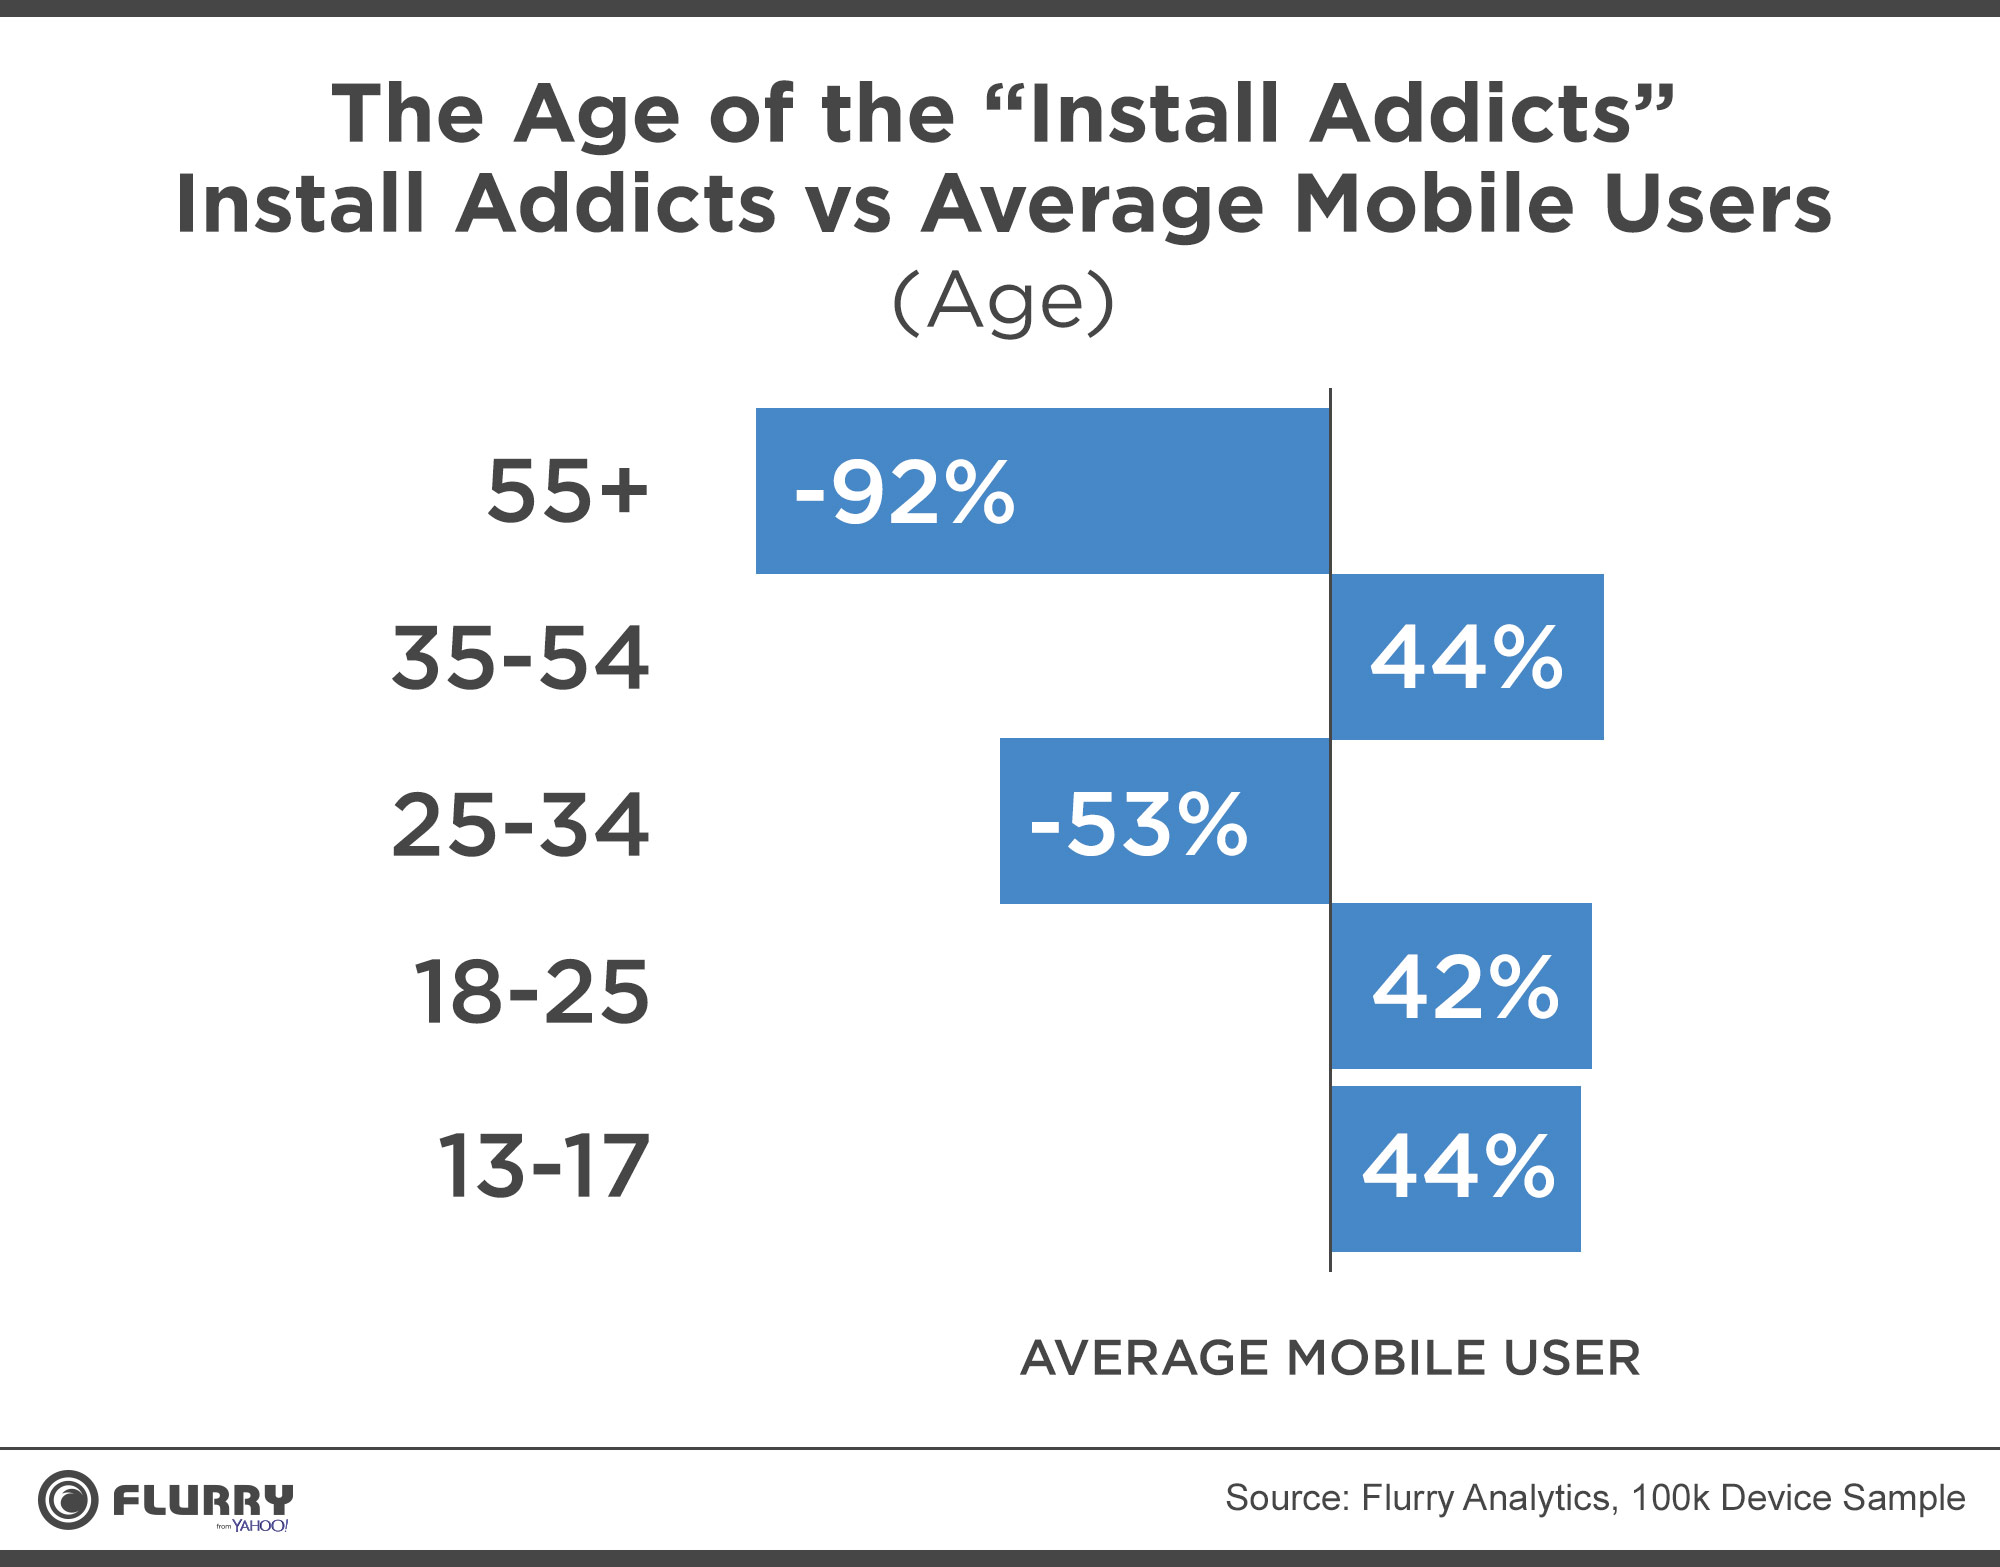
Looking deeper still it is evident that the biggest addicts are either tweens, young mothers, and perhaps house-wives.
This is of course taking into consideration the previous aforementioned data.
As for what I would guess the males of these age segments to represent, perhaps people like you and me.
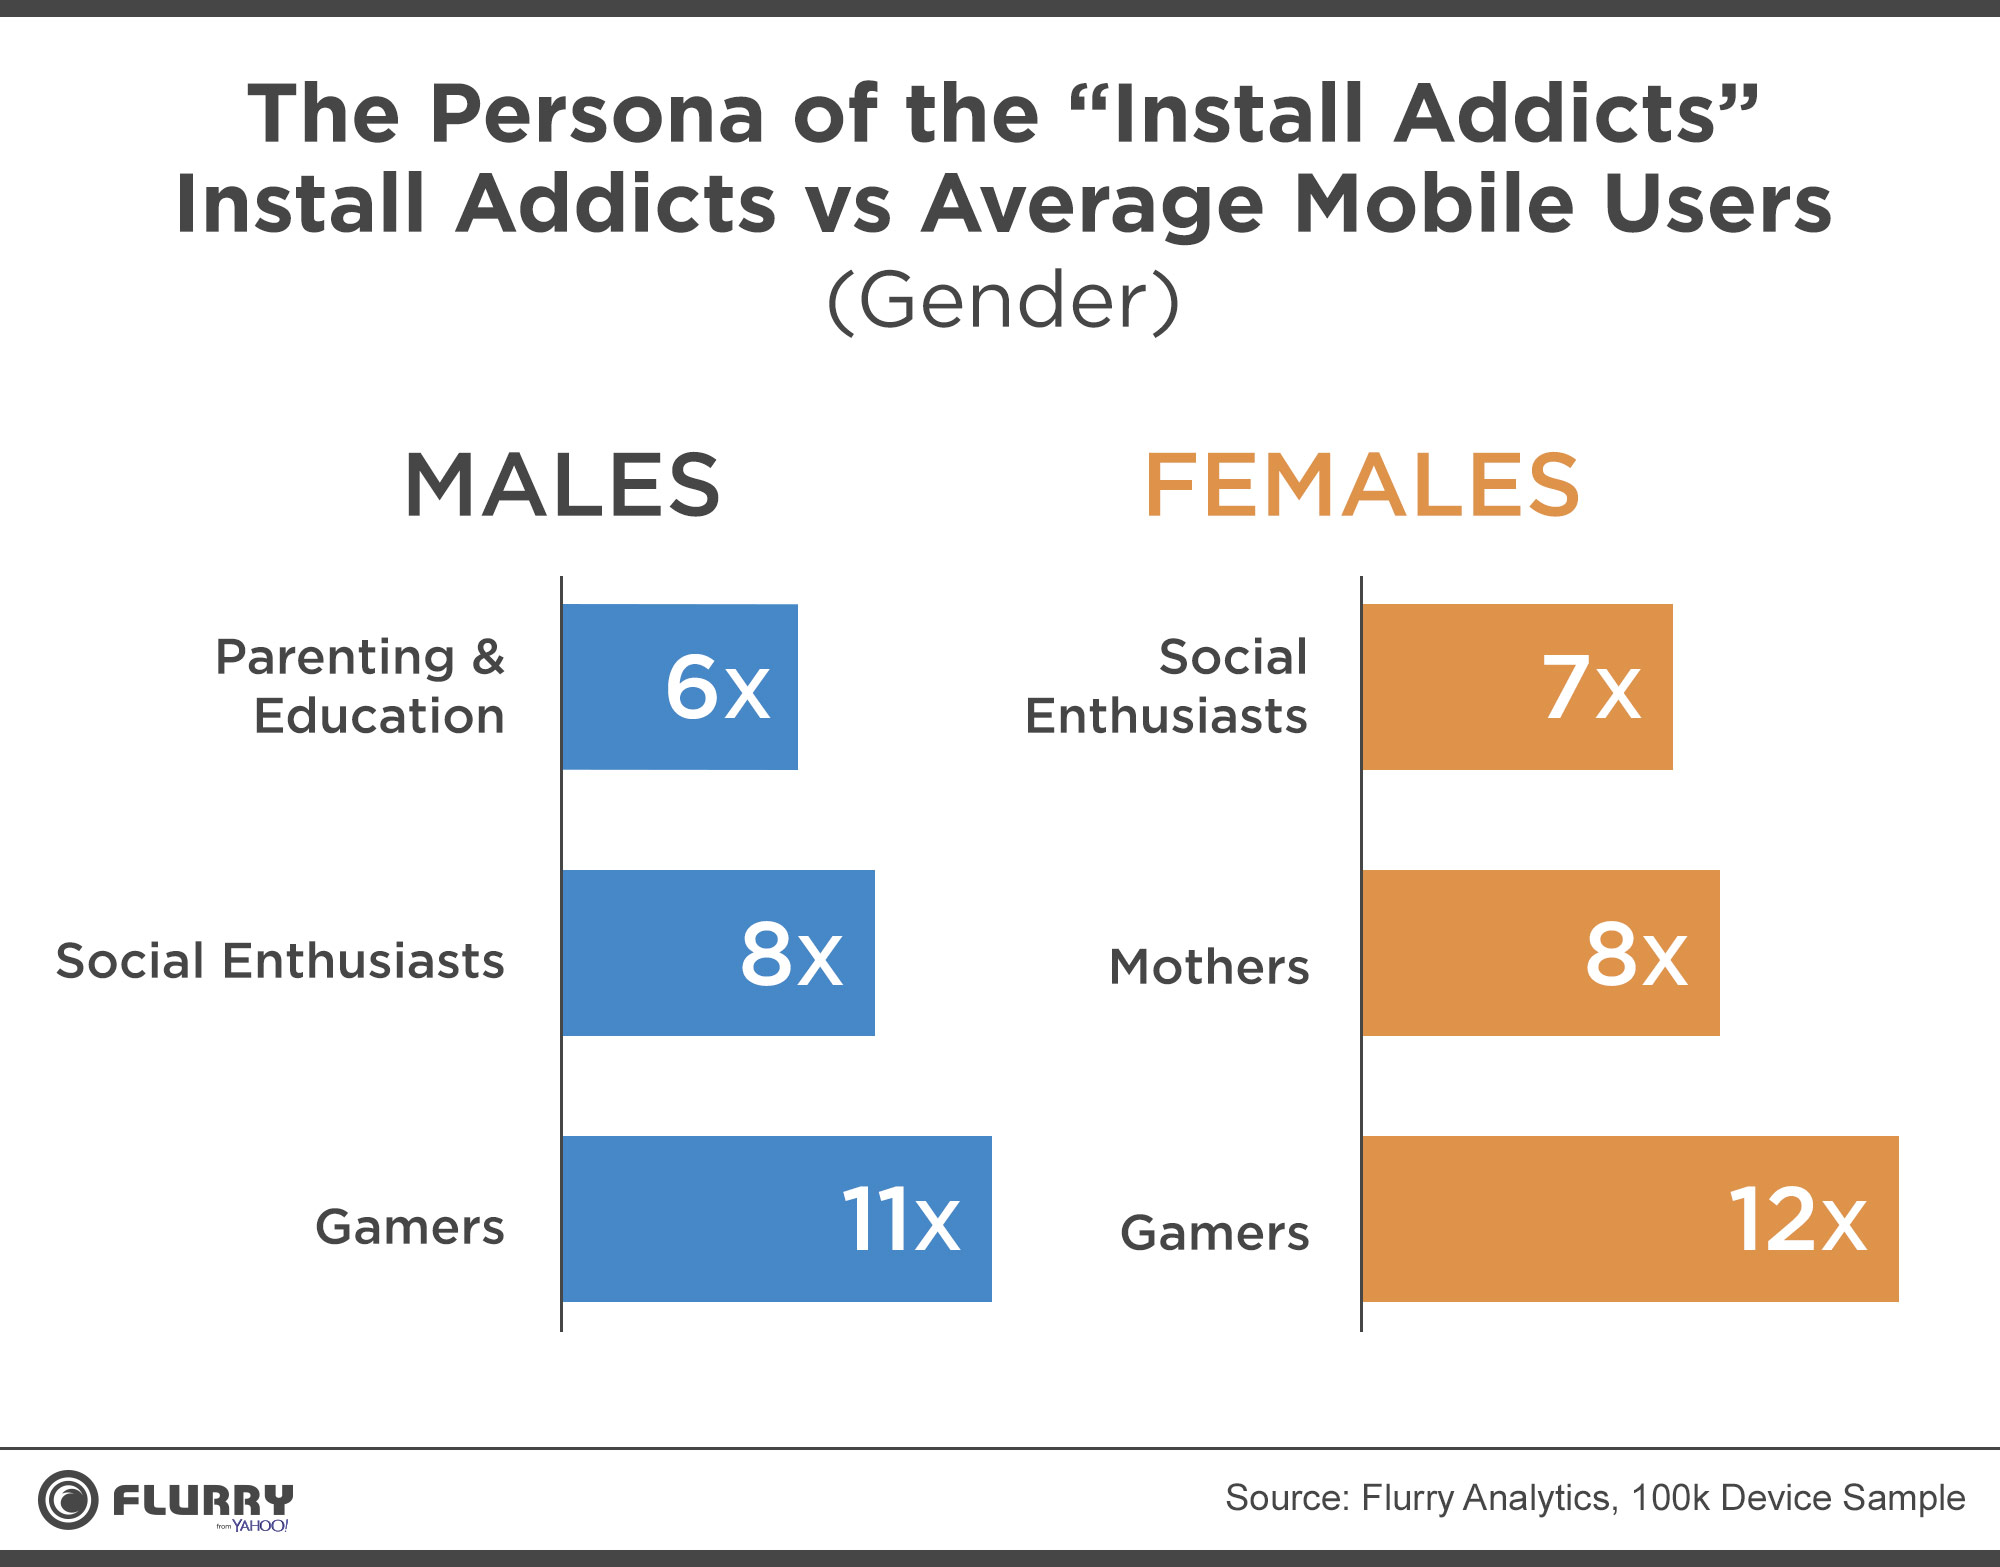
In our last image we can see that in-fact the largest % of Install Addicts are gamers. This is true for both male and females. But as any mobile analyst should know, the largest segment of female gamers are represented by mothers of newborns.
So, taking that into consideration you actually have 20x compared to 12x, and 8x respectively. One thing Flurry did not mention, or has yet to make clear however is this: given that this is true, what % of the 8/12x of their users is over-lap?
That may be something to ask them, but to conclude what we can takeway from these findings is:
- Mobile Install Addicts are the ones perpetuating app consumption.
- The majority of these mobile install addicts are females.
- The majority of these female mobile install addicts are between the ages of 13 & 25, and 35-54.
- When it comes to which types of apps they’re the most fond of: Games and Social take the cake as #1 and 2, respectively.
Questions, Comments?
Leave them below!
Kevin is an Online and Mobile Marketing Strategist who has worked with companies of all sizes over the last 6 years. You can follow Kevin on any of the social platforms below.


