
App Annie Index Chart Q4 2012
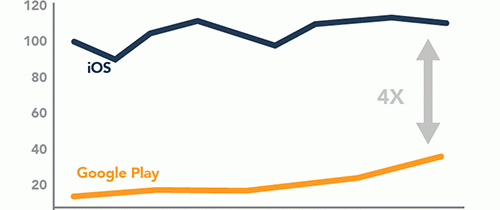
App Annie Index Chart Q4 2012 The folks over at App Annie have gone through the trouble of creating an article that assists people in ‘reading’ the store index charts they provide. I thought some of there points were worth sharing. So let’s jump into it! The chart above shows some important findings, and while it may be a bit unclear, that’s what I’m here to elucidate. The chart shows that during the month of October 2012, iOS worldwide revenues were four times larger than those of Google Play. iOS’s October 2012 monthly revenues were also 12.9% higher than their monthly revenues in January 2012. Google Play’s October 2012 monthly revenues however.. were 311% higher than their monthly revenues in January 2012. Needless to say, Google Play has shown some very impressive growth during the first ten months of 2012. But, it’s important to note the following: The comparisons are two single months of the year.It is not compounded growth across these months. It’s not a year-over-year...
Read More
![Mobile Minute – November 28th [VIDEO] Wrap-up](http://mobileminute.info/wp-content/uploads/2012/11/video-25817_256x210.png)